介紹
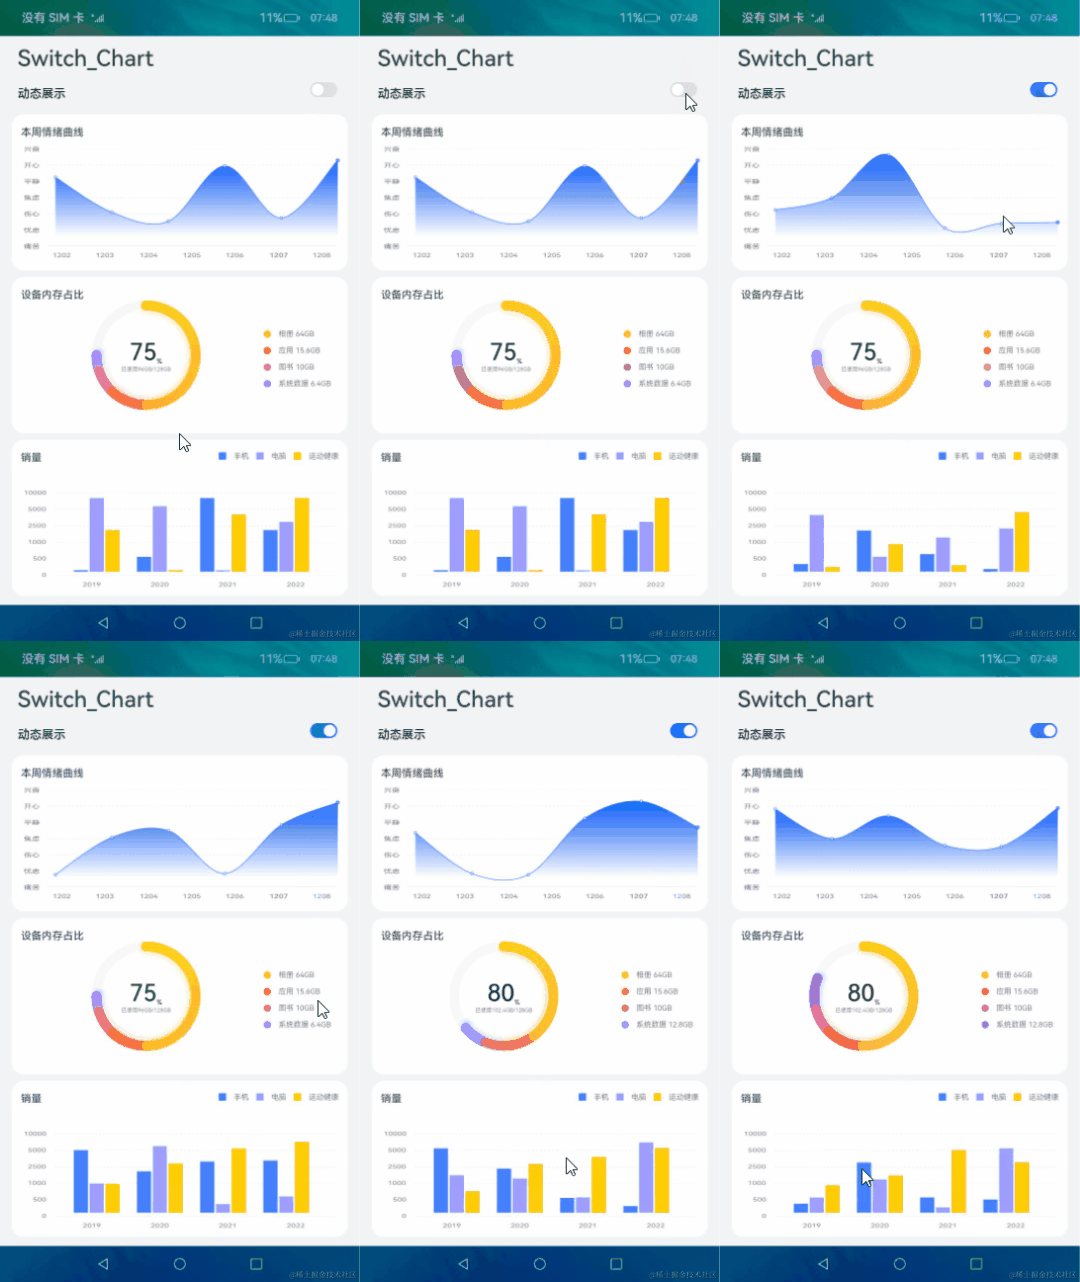
基于switch組件和chart組件,實現線形圖、占比圖、柱狀圖,并通過switch切換chart組件數據的動靜態顯示。要求實現以下功能:
- 實現靜態數據可視化圖表。
- 打開開關,實現靜態圖切換為動態可視化圖表。
相關概念
- [switch組件]:開關選擇器,通過開關,開啟或關閉某個功能。
- [chart組件]:圖表組件,用于呈現線形圖、占比圖、柱狀圖界面。
環境搭建
軟件要求
- [DevEco Studio]版本:DevEco Studio 3.1 Release及以上版本。
- OpenHarmony SDK版本:API version 9及以上版本。
硬件要求
- 開發板類型:[潤和RK3568開發板]。
- OpenHarmony系統:3.2 Release及以上版本。
環境搭建
完成本篇Codelab我們首先要完成開發環境的搭建,本示例以RK3568開發板為例,參照以下步驟進行:
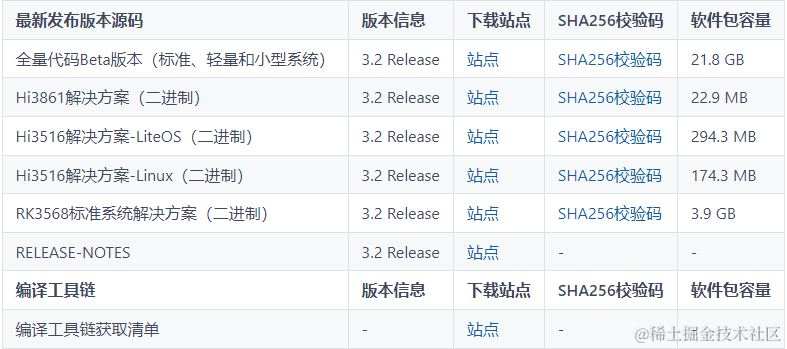
- [獲取OpenHarmony系統版本]:標準系統解決方案(二進制)。以3.2 Release版本為例:
- 搭建燒錄環境。
- [完成DevEco Device Tool的安裝]
- [完成RK3568開發板的燒錄]
- 搭建開發環境。
代碼結構解讀
本篇Codelab只對核心代碼進行講解,對于完整代碼,我們會在gitee中提供。
HarmonyOS與OpenHarmony鴻蒙文檔籽料:mau123789是v直接拿
├──entry/src/main/js	     // 代碼區
│  └──MainAbility
│     ├──common
│     │  └──images           // 圖片資源
│     ├──i18n                // 國際化中英文
│     │  ├──en-US.json
│     │  └──zh-CN.json
│     ├──pages
│     │  └──index
│     │     ├──index.css     // 首頁樣式文件
│     │     ├──index.hml     // 首頁布局文件
│     │     └──index.js      // 首頁業務處理文件
│     └──app.js              // 程序入口
└──entry/src/main/resources  // 應用資源目錄
構建主界面
本章節將介紹應用主頁面的實現,頁面從上至下分為兩個部分:
- 使用switch組件實現切換按鈕,用于控制chart組件數據的動靜態顯示。
- 使用chart組件依次實現線形圖、占比圖、柱狀圖。

本應用使用div組件用作外層容器,嵌套text、chart、switch等基礎組件,共同呈現圖文顯示的效果。
< !-- index.hml -- >
< div class="container" >
    < !-- 自定義標題組件 -- >
    < div class="switch-block" >
        < text class="title" >Switch_Chart< /text >
        < text class="switch-info" >{{ $t('strings.switchInfo') }}< /text >
        < !-- switch按鈕組件 -- >
        < switch onchange="change" >< /switch >
    < /div >
< /div >
在線形圖中,lineOps用于設置線形圖參數,包括曲線的樣式、端點樣式等。lineData 為線形圖的數據。
< !-- index.hml -- >
< div class="container" >
    ....
    < !-- 線形圖組件 -- >
    < div class="chart-block" >
        < stack class="stack-center" >
            < image class="background-image" src="common/images/bg_png_line.png" >< /image >
            < !-- 線形圖 -- >
            < chart class="chart-data" type="line" ref="linechart" options="{{ lineOps }}" datasets="{{ lineData }}" >
            < /chart >
        < /stack >
        < !-- 線形圖標題 -- >
        < text class="text-vertical" >{{ $t('strings.lineTitle') }}< /text >
    < /div >
< /div >
相對于線形圖,占比圖添加了自定義圖例。其中rainBowData為占比圖的數據。
< !-- index.hml -- >
< div class="container" >
    ....
    < !-- 占比圖組件 -- >
    < div class="gauge-block" >
        < div class='flex-row-center full-size' >
            < stack class="flex-row-center rainbow-size" >
                < !-- 占比圖組件 -- >
                < chart class="data-gauge" type="rainbow" segments="{{ rainBowData }}" effects="true"
                        animationduration="2000" >< /chart >
                ...
            < /stack >
            < div class='flex-column' >
                < !-- 自定義圖例 -- >
                < div class="chart-legend-item" >
                    < div class="chart-legend-icon rainbow-color-photo" >< /div >
                    < text class="chart-legend-text" >{{ this.$t('strings.legendPhoto') }} 64GB< /text >
                < /div >
                ....
            < /div >
        < /div >
        < !-- 占比圖標題 -- >
        < text class="text-vertical" >{{ $t('strings.rainBowTitle') }}< /text >
    < /div >
< /div >
在柱狀圖中,barOps用于設置柱狀圖參數,barData為柱狀圖數據。
< !-- index.hml -- >
< div class="container" >
    < div class="bar-block" >
        < div class="flex-column full-size" >
            < !-- 自定義圖例 -- >
            ...
            < stack class="full-size bar-height" >
                < image class="background-image" src="common/images/bg_png_bar.png" >< /image >
                < !-- 柱狀圖 -- >
                < chart class="data-bar" type="bar" id="bar-chart1" options="{{ barOps }}" datasets="{{ barData }}" >
                < /chart >
            < /stack >
        < /div >
        < !-- 柱狀圖標題 -- >
        < text class="text-vertical" >{{ $t('strings.barTitle') }}< /text >
    < /div >
< /div >
動態顯示數據
在上一章節講解了switch組件實現切換按鈕,接下來實現switch按鈕的點擊事件。在回調方法中設置chart組件靜態或動態顯示,靜態時chart組件顯示靜態數據,動態時利用interval定時器動態生成并顯示隨機數據。
// index.js
export default {
  ...

  /**
   * switch按鈕點擊事件的回調方法
   */
  change(event) {
    if (event.checked) {
      // 線形圖、柱狀圖數據定時器
      this.interval = setInterval(() = > {
        // 更新線形圖數據
        this.changeLine();
        // 更新柱狀圖數據
        this.changeBar();
      }, 1000);
      // 占比圖數據定時器
      this.rainbowInterval = setInterval(() = > {
        // 更新占比圖數據
        this.changeGauge();
      }, 3000);
    } else {
      clearInterval(this.interval);
      clearInterval(this.rainbowInterval);
    }
  }
}
實現changeLine方法更新線形圖數據。遍歷所有數據,重新生成隨機數并設置每個點的數據、形狀、大小和顏色,最后為lineData重新賦值。
// index.js
export default {
  ...
  /**
   * 更新線形圖數據
   */
  changeLine() {
    const dataArray = [];
    for (let i = 0; i < this.dataLength; i++) {
      const nowValue = Math.floor(Math.random() * CommonConstants.LINE_RANDOM_MAX + 1);
      const obj = {
        // y軸的值
        'value': nowValue,
        'pointStyle': {
          // 點的形狀
          'shape': 'circle',
          'size': CommonConstants.LINE_POINT_SIZE,
          'fillColor': '#FFFFFF',
          'strokeColor': '#0A59F7'
        }
      };
      dataArray.push(obj);
    }
    this.lineData = [
      {
        // 曲線顏色
        strokeColor: '#0A59F7',
        // 漸變填充顏色
        fillColor: '#0A59F7',
        data: dataArray,
        gradient: true
      }
    ];
  }
}
實現changeGauge方法更新占比圖數據,每三秒增長5%的數據。
// index.js
export default {
  ...
  /**
   * 更新占比圖數據
   */
  changeGauge() {
    const sysData = this.rainBowData[this.rainBowData.length - 2];
    sysData.value += addPercent;
    this.percent += addPercent;
    // 小數相加,保留一位小數
    this.used = (this.used * coefficients + addSize * coefficients) / coefficients;
    this.systemDataSize = (this.systemDataSize * coefficients + addSize * coefficients) / coefficients;
    // 數據總和到達100%后恢復初始數據
    if (sysData.value + CommonConstants.RAINBOW_OTHER_PERCENT > CommonConstants.RAINBOW_ALL_PERCENT) {
      sysData.value = CommonConstants.RAINBOW_SYSTEM_PERCENT;
      this.percent = CommonConstants.RAINBOW_USED_PERCENT;
      this.used = CommonConstants.RAINBOW_USED_SIZE;
      this.systemDataSize = CommonConstants.RAINBOW_SYSTEM_SIZE;
    }
    this.rainBowData = this.rainBowData.splice(0, this.rainBowData.length);
  },
}
實現changeBar方法更新柱狀圖數據。遍歷柱狀圖所有的數據組,獲取每組的數據后,再次遍歷每組數據,生成隨機數并為barData重新賦值。
// index.js
export default {
  ...
  /**
   * 更新柱狀圖數據
   */
  changeBar() {
    for (let i = 0; i < this.barGroup; i++) {
      const dataArray = this.barData[i].data;
      for (let j = 0; j < this.dataLength; j++) {
        dataArray[j] = Math.floor(Math.random() * CommonConstants.BAR_RANDOM_MAX + 1);
      }
    }
    this.barData = this.barData.splice(0, this.barGroup + 1);
  }
}
sf
-
鴻蒙
+關注
關注
57文章
2321瀏覽量
42749 -
HarmonyOS
+關注
關注
79文章
1967瀏覽量
30036 -
OpenHarmony
+關注
關注
25文章
3665瀏覽量
16162
發布評論請先 登錄
相關推薦
HarmonyOS開發案例:【image、image-animator組件】

HarmonyOS開發案例:【基礎組件Slider的使用】


 HarmonyOS開發案例:【 switch、chart組件的使用】







評論